
Has gun control made Baltimore safer? Data analyst says ‘No’
Guns on a table (credit Ron Waddington Wikimedia Commons)
My name is Brian Bissett. I reside in Howard County, Maryland, and I am the author of two peer-reviewed books on Data Analysis. I am writing today OPPOSING the following bills which are currently being considered by the Maryland State Legislature.
HB92, HB95, HB96, HB523, HB612, HB1343, SB8, SB113, SB346, SB737, AND SB1000.
All of these proposed laws will enjoin honest citizens from freely exercising their right to utilize firearms for lawful purposes in various ways by actions such as requiring an expensive license to purchase a long gun, prohibiting possession of certain common firearms, and eliminating any civilian oversight of State Police decisions pertaining to handgun permits.
My opposition to additional gun control legislation is not an emotional reaction but is rather based on a careful analysis of Baltimore City crime compared to its sister cities in terms of population, wealth and proximity. I have also analyzed firearms crime in Baltimore City both before and after the implementation of the Firearms Safety Act of 2013.

ALL DATA IS FROM THE FBI UNIFORM CRIME REPORT, THE BALTIMORE CITY POLICE DEPARTMENT (OPEN BALTIMORE CRIME DATA), AND THE GIFFORDS LAW CENTER (A GUN CONTROL GROUP.)
The charts depicting crimes in Baltimore City contained herein only show Crimes COMMITTED WITH FIREARMS. Robberies are only robberies by means of a firearm, not a knife or other implement. Assaults and Murders are only those assaults or murders committed with a firearm (nearly always a Handgun.)
The strength of Gun Laws is subjective, so I used the Gifford’s Gun Report (an Anti-Firearms Organization) to denote the relative strength of gun laws for the States and Cities compared with Baltimore.
When examining the graphs, it is important to have an understanding of the Giffords’ Grades which range from “A” to “F”.
A state which does background checks on all new gun sales and issues carry permits to people who undergo training and have no criminal record will get an “F”.
A grade of a “B” or “A” is not possible without doing most of the following:
Banning civilian possession of many firearms in common use.
Banning standard capacity magazines.
Forbidding citizens from obtaining a permit to carry a firearm for self-protection without proving a need to do so.
Having a red flag law which authorizes confiscation of personal firearms with delayed due process.
The “C” grade is a pivotal point on the scale, as it marks a transition from checking and training to prohibitions. Most of the states in the country have a “D” or “F” grade.
The trend that emerges is that once firearms laws go beyond requiring a background check for purchase and safety training, robberies, assaults, shootings, and murders with firearms rise. This trend was not just present in Baltimore, but the “like” cities it was compared with.
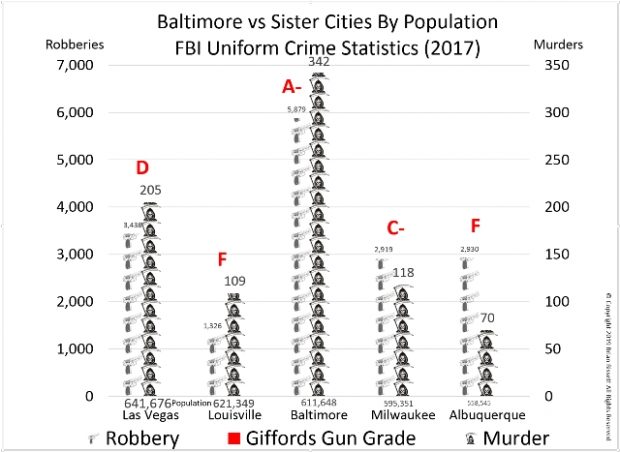
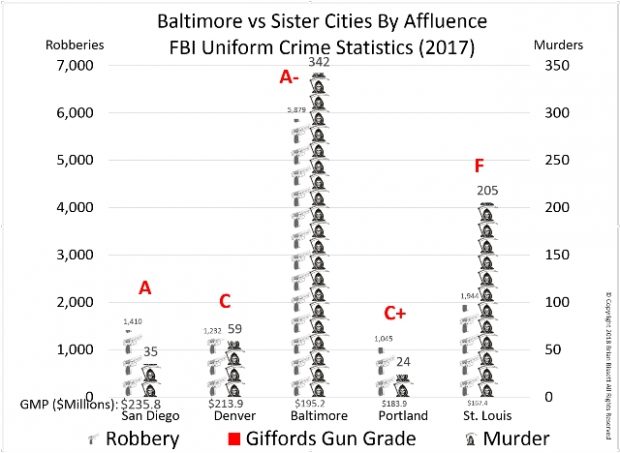
The first three charts show Crime in Baltimore in Comparison to its Sister Cities in terms of Population, Wealth, and Proximity. Baltimore has the strongest Gun Laws and the highest Crime Rates in every case.
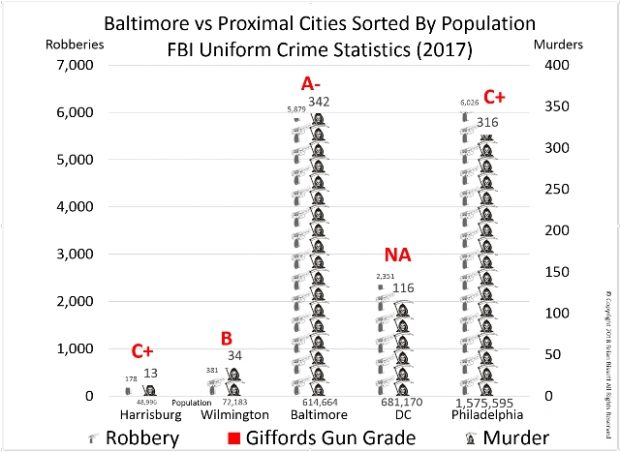
Baltimore and Washington DC are close in both proximity and population with 614,664 vs. 681,170 residents respectively. Violent crime of all types increased by 13 percent in Baltimore, but decreased by -15% in Washington DC. In fact, Washington DC’s crime decreased across the board: murders -16%, robberies -25%, and assaults -6%.
A one-quarter decrease in robberies is unprecedented. It happened only after the courts required Washington DC to end many of its restrictions on firearms and become a shall issue jurisdiction for handgun permits. Contrast this to Baltimore which has seen violent crime continue to rise in all categories by 13%.
In Baltimore, crime increased across the board: murders 8%, robberies 12%, and assaults 13%. Baltimore has three times the number of murders as Washington DC and twice as many assaults and robberies.
Philadelphia is more than twice the size of Baltimore in population and more than 1.5 times the size in land area; yet Baltimore had twenty six more murders, and a comparable number of robberies and assaults. Philadelphia has a Giffords gun grade of a “C+”, while Baltimore has a Giffords grade of “A-“.
When Giffords raised the Las Vegas grade from an “F” in 2017 to a “D” in 2018, the number of murders in Las Vegas increased by 30% from 158 to 205. When Portland Oregon had its grade raised from a “C” to a “C+”, murders rose by (71.4%), from 14 to 24, and it suffered an additional 59 robberies and an additional 68 assaults.
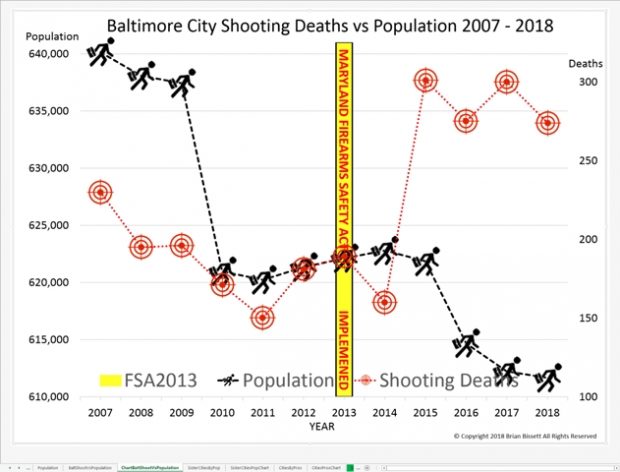
The next chart shows the POPULATION and the DEATHS by SHOOTING in BALTIMORE CITY from 2007 to 2018.
The FIREARMS SAFETY ACT OF 2013 was implemented in OCT 2013.
Shootings were TRENDING DOWNWARD and Population loss was leveling off in Baltimore City prior to the Passage of the FIREARMS SAFETY ACT OF 2013, which was pushed for by Governor O’Malley.
In 2015, DEATHS by SHOOTINGS in Baltimore City roughly doubled and have not fallen since. Baltimore has on average 275 to 300 people shot to death each year, up from about 150 to 175 prior to the passage of the FIREARMS SAFETY ACT OF 2013. Population flight from the City of Baltimore has also resumed as people are fleeing from the sharp increase in violence permeating every area of Baltimore City.
The next series of charts plot crime in Baltimore City before and after the Firearms Safety Act of 2013.
The Firearms Safety Act of 2013 was implemented with the hope of making Maryland safer, but it did not make Maryland safer. Crime utilizing Firearms in Baltimore City got significantly worse in Baltimore City after the Firearms Safety Act, and Deaths caused only by Shooting with a Firearm DOUBLED and have not fallen since.
The single most significant causal attribute here was the implementation of the Firearms Safety Act of 2013.
It can be said with certainty that none of the extremely stringent Gun Control laws implemented in Maryland lowered crime in Baltimore City.
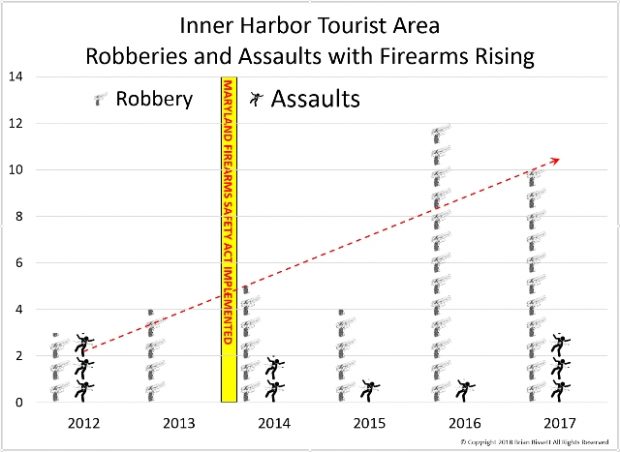
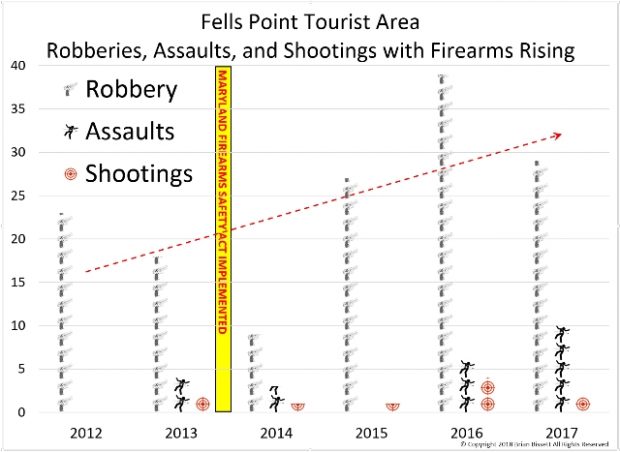
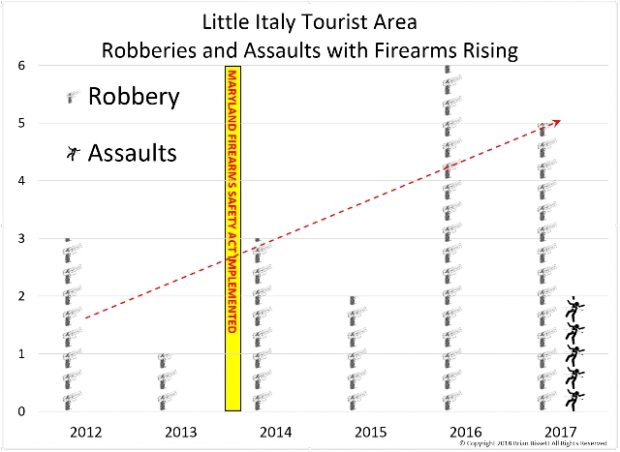
The charts below show how violent Crime with Firearms continues to rise in the Tourist Areas of Baltimore City (the Inner Harbor, Fells Point, and Little Italy), which are getting extremely dangerous to visit.
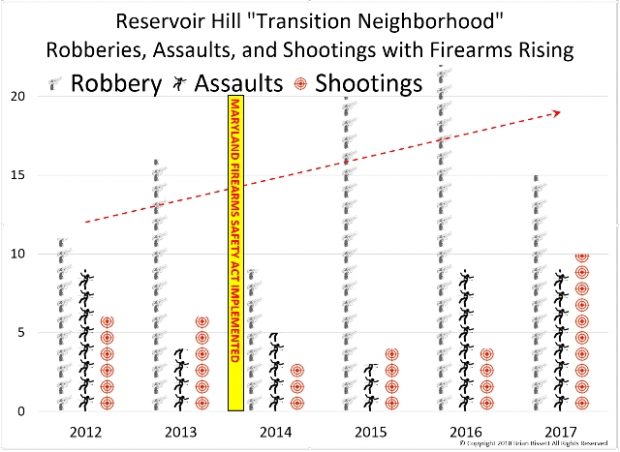
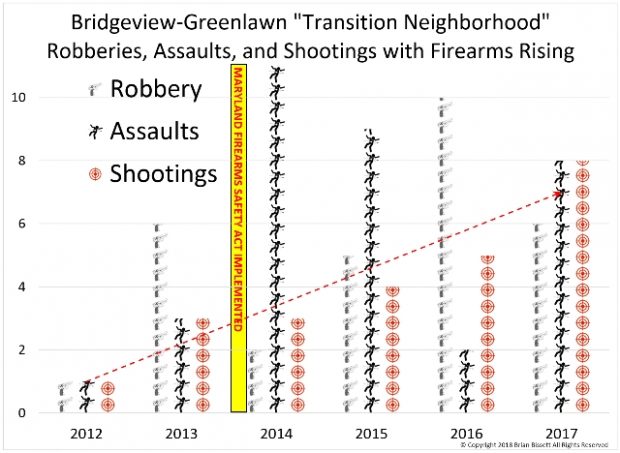
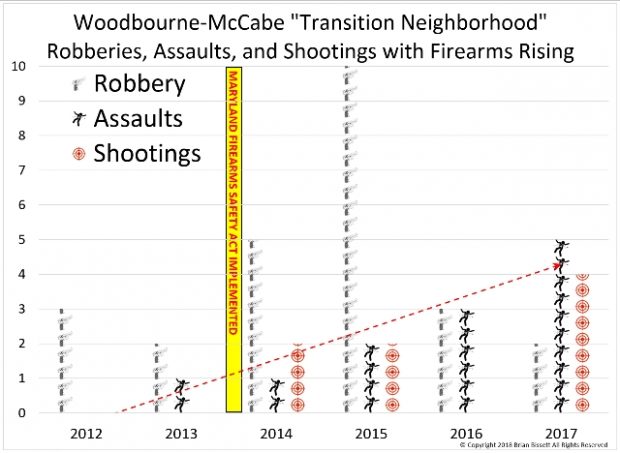
The next three graphs depict three areas identified by “Live Baltimore” as “Transitional Neighborhoods” in Baltimore City: Reservoir Hill, Bridgeview-Greenlawn, and Woodbourne-McCabe.
While the home prices are rising in these neighborhoods, that is not the only thing rising.
All of these neighborhoods are transitioning from bad to worse in terms of robberies, assaults, and shootings with firearms.
SUMMARY
Additional laws impeding lawful citizens from acquiring firearms in Maryland has had no effect on reducing violent crime committed with firearms in Baltimore City.
Baltimore had greater numbers of murders, assaults, and robberies in 2018 than 2017, despite the passage of more gun control laws.
Respectfully Submitted,
Brian Bissett
Howard County, Maryland resident Brian Bissett is the author of two peer-reviewed books on Data Analysis.
Weapons have always taken place in society
Congratulations Baltimore on being named the most dangerous city in America by USA Today sure glad they named it the Firearms Safety Act. Can’t imagine how bad it would have gotten if they passed a shall issue concealed carry permit process ( sarcasm off)
Excellent analysis. It is chock full of data, unlike the “feelings” that guide the gun grabbers.
I write this as a Maryland resident, currently travelling in America, and carrying a handgun. If i was in Maryland, I’d be a felon, because Maryland punishes gun owners, not criminals. Maryland does not lead the pack on gun control, it is behind the times. It is the innocent law abiding people that pay the price for Maryland’s gun control laws.
Yes, this analysis presented is not exhaustive nor is it to the level of peer reviewed journal articles. It is however, better than most “analysis” presented by groups like the Giffords Grab. At best, it shows that the draconian gun laws that leftists want don’t seem to have the effect of reducing gun violence. At worst, it shows that gun bans make violence easier for the criminal who won’t follow the law.
One thing this analysis does well, is that it keeps an apples to apples comparison the whole time. Most often, when you read pro gun control articles, they interchangeably mix the terms gun violence, gun homicides, and homicides in order to cherry pick the stats that fit the narrative. For example, states like Alaska will be shown as states with high levels of “gun violence” based on the number of suicides committed with guns, and then compared to places like Maryland that have much higher homicide rates, but lower gun suicide rates. Not necessarily a lower suicide rate, but a lower number with guns.
I concur with the first commentator’s assessment that the data used is selective and therefore the results skewed. It’s important to note that the Freddie Gray riots were not “race riots” but rather a consequence of police brutality and corruption. The rise in police corruption, as well as the resulting police “work-slow-down” post-riots is not factored into these graphs. Also excluded is the record number of firearm purchases (the influx of guns) in MD in the run-up to the passage of MFSA legislation. Finally, I point to the graphs themselves to illustrate that gun deaths were on a downward trend until after 2014 when the influx of guns made it to the streets, police corruption reached a crescendo, and our police force decided to go hands-off. As a responsible firearms owner, a huge part of that responsibility as any fellow lawful firearms owner knows is safety. With that in mind, I consider the publication of this non-peer reviewed “analysis” to be reckless.
Clarification: I was referring to the “prior” commentator – the one below mine.
what influx of guns to the streets are you referring to?
I agree that the data shows that crime has gone up, but i’m failing to see how causation is proven between the passage of 2013 legislation and the spike in crime that immediately followed the Freddie Gray incident in 2015. To attribute the rise in crime to a firearms bill without examining the enormous consequences of race riots in relation to crime and safety seems like a fairly significant oversight.
Instead of questioning the messenger, you could look at the data itself. It’s rather self explanatory.
What qualifications must one have to be a data analyst? An accredited degree? Pass a state licensure test?
Generally, it is a job title. I worked as a data analyst until a few months ago, and managed analysis projects. You could have a degree in computer science, math, operations analysis, statistics, engineering, or even less scientific fields and get a job in that field. Also, there is a great range of complexity in data analysis. An analyst could simply collect financial data and compare it to last year’s data, or they could run various statistical and analytic tests and procedures looking for various insights.
It’s obvious that Democrat controlled States and Municipalities all have higher rates of crime inversely proportional to restricting gun rights. Fewer lawfully carried firearms, the higher the crime. Criminals have no fear of retaliation from their victim.