
Commentary: Maryland COVID-19 Metric Stats ‘Skewed and Faulty’
BALTIMORE — As a data analyst, I have closely watched a series of recent press conferences by Maryland Gov. Larry Hogan, where he said he believes the state is now in a position to slowly begin re-opening. Unfortunately, after privately tracking daily reported cases and death rates from COVID-19 in Maryland, I believe the metric that the Governor’s office is choosing to utilize is skewed and faulty.
To begin, I would like to emphasize the intention of this article is not to criticize those tasked with making life-altering decisions for the citizens in Maryland on the basis of imperfect information. This is an unenviable task which all leaders must do with unfortunate regularity. The intention is to present a holistic interpretation of the data considering both the quantitative and qualitative aspects of the COVID-19 pandemic that in my opinion is more consistent with reality than the narrative presented by Annapolis.
First, a look at the raw data Maryland has collected for daily new COVID-19 cases which are presented in the chart labeled “Daily New COVID-19 Cases.”
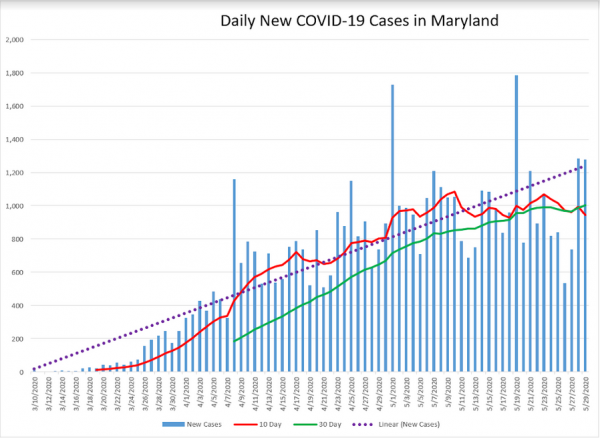
The blue bars represent daily new COVID-19 cases confirmed by testing. While there is a significant standard deviation between successive data points, the trend of new cases is rising not falling, as signified by the purple linear regression which is a fair representation of the behavior of this highly variable dataset. What can be said with certainty is that the curve was not flattened by the lockdown in Maryland. Now many may argue that had the lockdown not occurred, Maryland would have experienced exponential growth in cases, all of our hospitals would be overwhelmed, and thousands of more people would have died. That is conjecture about a pathogen for which we have no prior experience and limited data. What is known is the curve did not flatten after the lockdown.
The chart also contains a 10-day moving average (red line) and a 30-day moving average (green line). The 10-day moving average is more responsive to the immediate behavior of the virus, while the 30-day moving average is a slower moving longer-term trend. Yesterday, the 10 day average dipped below the 30 day average for the first time, indicating the growth of new cases was slowing; not ending, but slowing. Slow growth is still growth. However, similar behavior occurred on May 18, but shortly afterward the 10-day moving average pulled away from the 30-day moving average and new infections surged. There is no evidence from a numerical standpoint this situation is improving.
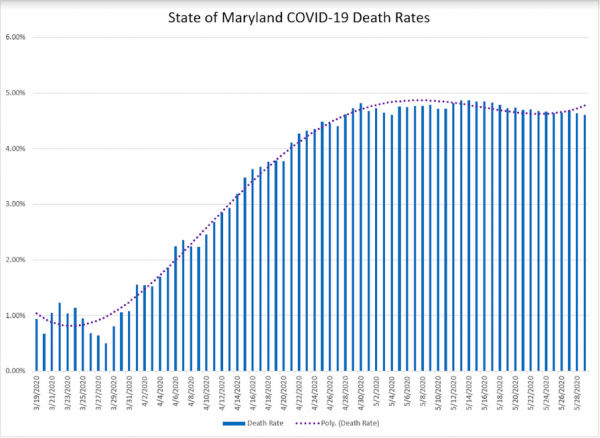
Looking to the second chart showing the death rates from COVID-19 in Maryland, they have risen from under one percent to a steady-state level for the last month between 4.6% and 4.9%. There is no sign that deaths from COVID-19 are diminishing in Maryland, or that the morbidity rate for the infected is transitioning to a state of less severity. On the day this was written, Maryland had a total of 50,988 cases of COVID-19 and 2,348 deaths from the virus for a death rate of 4.6%.
I have listened to Governor Hogan’s press conferences about how the COVID-19 situation is improving and Maryland is ready to begin re-opening. The metric that the Governor cites repeatedly is the Percent Positive Testing, or of everyone tested in Maryland on a given day for COVID-19, how many actually had COVID-19. He cites that this percentage has fallen by 50% in some of the hardest-hit areas of Maryland, such as Prince Georges and Montgomery counties. The metric that the Governor’s office is choosing to utilize is skewed and faulty, because the testing population has become asymmetrical over time.
When Maryland first began testing people for COVID-19, a person needed to be very sick and have a doctor authorize a test. This resulted in the early testing pool having people who presented as very ill and either had COVID-19, the flu, or a similar Influenza like illness (ILI). The state now has enough testing kits that any hypochondriac who wants a test can go to a drive thru center and get one for free. The testing pool is not the same.
So, when Hogan boasts that in Prince Georges County a 40% positivity rate declined to a 20% percent positivity rate, my response would be of course it did, the new testing pool contains an imbalance of people who are much less likely to be sick. That is not a justification to open up. That is a false metric.
Of all the metrics available one could use to show things were improving, why did the Maryland government choose this metric?
My personal belief is it was the easiest to subject to manipulation.
The Governor could not state the death rate or the number of new cases has been falling, because they are not. The Maryland government chose to close our society, which is going to result in long-term double-digit job losses, foreclosures, and people losing their businesses, personal savings, and possibly retirement savings to weather this shutdown.
The government is not going to admit this was ineffective.
They are not going to say “Sorry you lost everything important to you, we made an error.”
The real problem here is neither the Governor, Senators, or Delegates had any moral hazard associated with the decisions they made. By choosing this metric they can point to something and claim how effective their policies and leadership were, even when by any reasonable measure this was a failure. Unfortunately, the people ultimately are bearing the consequences of these bad policy decisions, which by any metric is frequently the case.
There are so many unknowns associated with this pathogen, how it functions, what the true values of its critical parameters are, and its vulnerabilities. We do know that between 50 to 80 percent of infected people show no symptoms. We also know that a person is infectious for a long period of time. My best attempt at modeling this is that by the time you are reading this most people in Maryland will have been exposed to the virus. If I had to guess, our worst two weeks in Maryland will be the first two weeks of June, after which cases will begin to decline. Any number of factors could however make such a prediction moot. For example, if sunlight turns out to rapidly deactivate this virus, or prior illness confers no immunity or herd immunity, then all bets are off.

For a small minority of people, an infection of COVID-19 is going to have a devastating impact, taking decades off their lives or leaving them near cripples with reduced lung function. The likelihood versus impact matrix is much like a tornado. When we know a tornado is forming, we advise people to take shelter. It is not rational however to expect people to stay trapped in their homes in anticipation of a tornado. The response to COVID-19 would have been appropriate for an airborne version of Ebola, but when we run the cost-benefit analysis it is difficult to justify having destroyed our economy over COVID-19.
The reason given for shutting down was not to save anyone’s life. It was to prevent the hospitals from being overrun, and having people lose their lives who otherwise would have recovered if an ICU bed and ventilator were available. That however is a small minority of patients, and it is equally possible that once the hospitals began to fill up and people started dying from lack of available care, that individuals would begin self-quarantining and taking this seriously. We would not have had to fine them or threaten them to do what is in both their own best interest and society’s best interests, it would have been self-evident what they needed to do, and they would have voluntarily done it.
Every person on planet earth is going to be exposed to this virus soon. That cannot be changed. The only thing we can control is how we choose to deal with the situation. We have the Joe Biden mentality of “if it saves just one life we should do it no matter what the cost” versus the Donald Trump mentality of “If it costs us one extra dollar we shouldn’t do anything.” Between these two extremes lies a rational public policy, and Sweden probably got it right.
Howard County, Maryland resident Brian Bissett is the author of two peer-reviewed books on Data Analysis.