
How legislators compare to the people they represent
By Len Lazarick
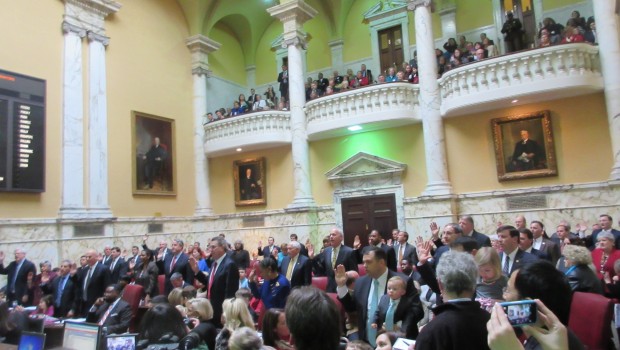
Over the next four weeks, Maryland’s 188 lawmakers will cast votes on hundreds of bills, particularly this week as they head to next Monday’s crossover deadline. Meeting the deadline guarantees any bill passed by one house will at least get a hearing in the other.
These 133 men and 55 women may represent a state population approaching 6 million, but as even this gender breakdown indicates, their demographics show they are hardly representative of the population as a whole.
The members of the Maryland General Assembly are far older, better educated and much more married than the population they represent, according to figures compiled by the Department of Legislative Services in January.
And while the two-thirds who are men still dominate in a state that is 51.5% female, the lawmakers are only slightly whiter than the population as a whole, based on Census figures. But they are apparently a lot more religious, with a greater percentage of Protestants, Catholics and Jews than in the greater population — or at least claim to be so.
And contrary to popular belief that there is a greater number of full-time legislators than there were in the past, there are about the same number of full-time legislators (36) as there were 24 years ago (38). There are slightly fewer practicing attorneys (40 or 22%) than there were in 1991 (43).
Birthplace: 59% of the members were born either in Maryland (49%) or the District of Columbia (10%) where many who actually lived in Maryland were born.
Age: 22% of the legislature (40 members) are 65 or older, including the two presiding officers and five of the 12 chairs of standing committees. That compares to just 13% of the Maryland population as a whole, and is slightly more senior than were in the legislature 24 years ago, when 18% were over 60.
(Some of the member profiles compiled over the years use different age brackets.)
Overall, 63% of the legislature is over 50, and just 8% is 34 or under, not surprising given the life experience needed to get elected.
Education: 53% have postgraduate degrees of some sort, and another 31% have bachelor’s degrees, for a total of 84%, while only 37% of the general population 25 or older has a bachelor’s degree. Forty-seven have J.D.’s (25%), but seven of those do not practice law; four are medical doctors, but one no longer practices.
Occupations: In addition to the lawyers and full-time legislators who make up 41% of the General Assembly, about 15% own their own business, and another 6% work in business, and there are a number of other occupations represented.
Race: 71% (131) of the legislature is Caucasian, compared to 61% of the state population; 24% (45) are African-American compared to 30% of all Marylanders. With the election of several more legislators of Asian descent last year, 5% of the legislators (9) are Asian American compared to 6% of the population.
Marriage: 74% list themselves as married compared to 50% of the general population, down slightly from 81% in 1991.
Religion: Over a quarter of the legislature (26%) did not state a religion, but that compares to 58% of the general population who are not claimed by any denomination, according to the Association of Religion Data Archives.
37% are Protestant or members of other Christian denominations compared to 23% of the population; 26% are Catholic compared to 14% of the population; and 9% are Jewish compared to 4.3% of the population.
These figures are much lower than in 1991, but in that year, only 7% of the legislature did not report a religious affiliation. These affiliations also reflect active members of congregations, as opposed to believers who did not attend services.
Veterans: While the number of military veterans is far lower than in an earlier era when there was a military draft, there are still more veterans than in the general population. 17% of the legislature served in some branch of the military compared to about 7% of the general population.
Party: The biggest and well noted trend of the last 30 years is the growing number of Republicans as they have taken districts once held by conservative Democrats.
In 1985, there were just 23 Republicans in the entire legislature, six in the Senate and 17 in the House. There are now a total of 65 Republicans, 14 in the Senate (there were once 15 from 1995-2000) and 50 in the House of Delegates, 7 more than in 2011 and 2003, and the highest number ever in both the House and legislature as a whole.
Then again, the legislature includes representation of just two parties, and there is no representation at all for the 20% of voters who chose to register with minor parties or chose no party affiliation at all.

MarylandReporter.com is a daily news website produced by journalists committed to making state government as open, transparent, accountable and responsive as possible – in deed, not just in promise. We believe the people who pay for this government are entitled to have their money spent in an efficient and effective way, and that they are entitled to keep as much of their hard-earned dollars as they possibly can.